
Statistics
The Statistics page (MAIN → Statistics menu) is a deep dive into your traffic. Unlike the "Dashboard", which gives an overview, here you get the whole funnel step by step, a day-by-day breakdown, split results, and a table by sub tags. And all of it can be narrowed down to a single PWA.
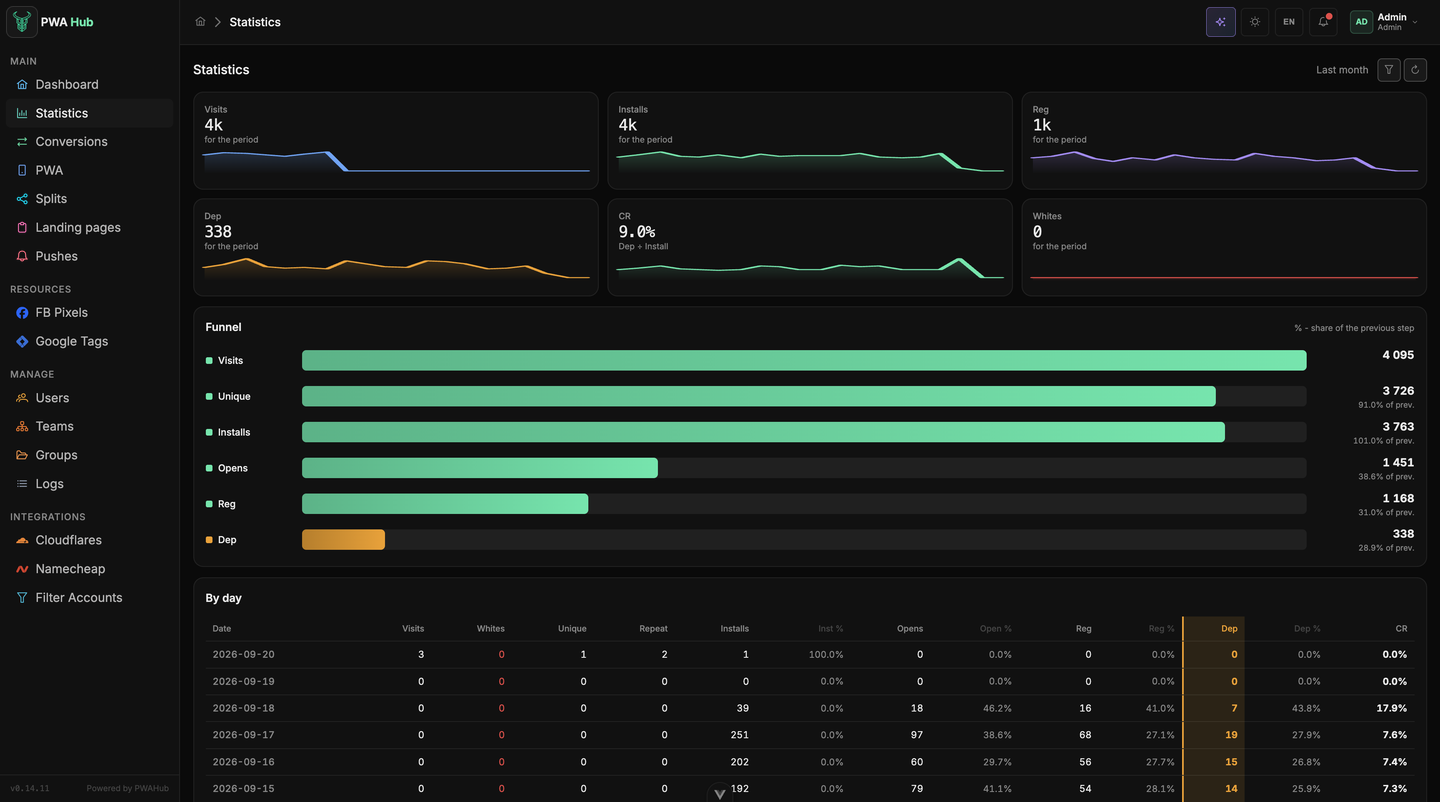
Filters at the top
The current period is labelled above the content on the right, and all the controls hide in the popover behind the funnel button:
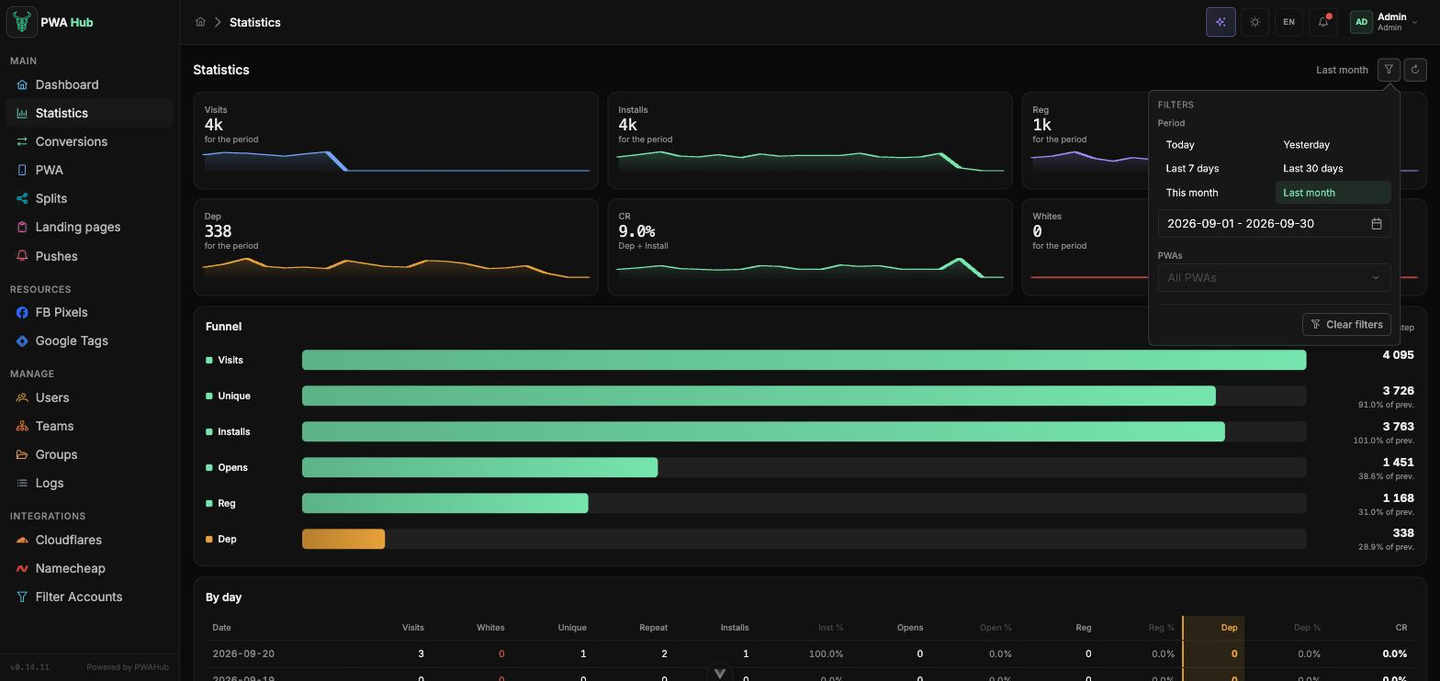
- Period - the presets Today, Yesterday, Last 7 days, Last 30 days, This month, Last month, or your own range in the field below.
- PWAs - by default all apps available to you are shown; pick one and the whole page (funnel, days, sub tags) recalculates for it alone.
- Clear filters returns the period and the app selection to their defaults.
The arrows button refreshes the data manually; the page also picks up fresh numbers over the socket while it's open. As on the dashboard, a range longer than 31 days narrows down to the last month.
The period's figures
Six cards with sparklines: Visits, Installs, Reg, Dep, CR (the caption under the number repeats the formula - Dep ÷ Install) and Whites. Every figure is the total for the selected period.
The funnel
The funnel follows the path of your traffic: Visits → Unique → Installs → Opens → Reg → Dep. To the right of each step sit its value and the percentage of the previous step - the hint above the funnel says as much.
The denominators are worth knowing exactly, otherwise the numbers surprise you:
| Step | The percentage is |
|---|---|
| Unique | uniques ÷ visits |
| Installs | installs ÷ uniques |
| Opens | opens ÷ installs |
| Reg | registrations ÷ installs |
| Dep | deposits ÷ registrations |
Why a percentage can exceed 100%
Visits, uniques and whites are counted by the date of the visit itself, while installs, opens, registrations and deposits are counted by the date the event arrived. These are different sources, and over a short period a step easily goes above 100% of the previous one: the events belong to visits that happened before the selected window. Over a longer period the gap evens out.
By day
The By day table lays the same funnel out by date. The columns are Date, Visits, Whites, Unique, Repeat, Installs, Inst %, Opens, Open %, Reg, Reg %, Dep, Dep % and CR. The Total row at the bottom is the result for the whole period. Hover any percentage and the tooltip shows which two numbers produced it.
The Whites column answers "how much traffic the filter screened out", and Repeat answers "how many visits came from people who had already been here". Lots of whites alongside live visits means it's worth checking the filter and the stream settings; far more repeats than uniques means the traffic is going in circles.
Splits
The Splits block shows how your split tests performed over the period: status, visits, installs, conversions and CR for each. Expand a row to see the breakdown by flows inside the split. The block is only visible while no single app is selected: pick one PWA and the splits disappear, since distributing traffic between apps is no longer the point. More about splits themselves - in "Splits and flows".
Sub statistics
The bottom block answers "which setup actually delivers". If you tag your traffic with sub tags - campaign, creative, source, buyer - here those tags turn into a table.
You pass the tags yourself, as ordinary parameters in the ad link. There are 20 slots: sub_1 … sub_20. For example:
https://your-domain/?sub_1=fb-campaign-42&sub_2=creo-a&sub_3=buyer-ivanWhat goes into them is up to you: usually the campaign, creative, source, GEO preset or buyer name. Every visit stores its tag values, and those are what the table shows.
The spelling is forgiving
Parameters are accepted both as sub1 and as sub_1, upper or lower case - everything is normalized to one form. Slots outside the 1-20 range are ignored, and a value can be up to 512 characters.
The tags travel on - to the offer
The same sub tags are automatically appended to the offer link on redirect, and the macros {sub1} … {sub20} let you place them exactly where you need in the address. More in "Offer links".
How to read the table
Two controls sit above the table:
- Group by - which slot to group by: Domain or
sub_1…sub_20. Picksub_2and the table shows a row per value of that tag. Domain breaks visits down by the domains visitors came to - this shows which domain performs better. - Search by value - search within the selected slot's values (substring, case-insensitive). Handy when there are hundreds of tags and you need one campaign.
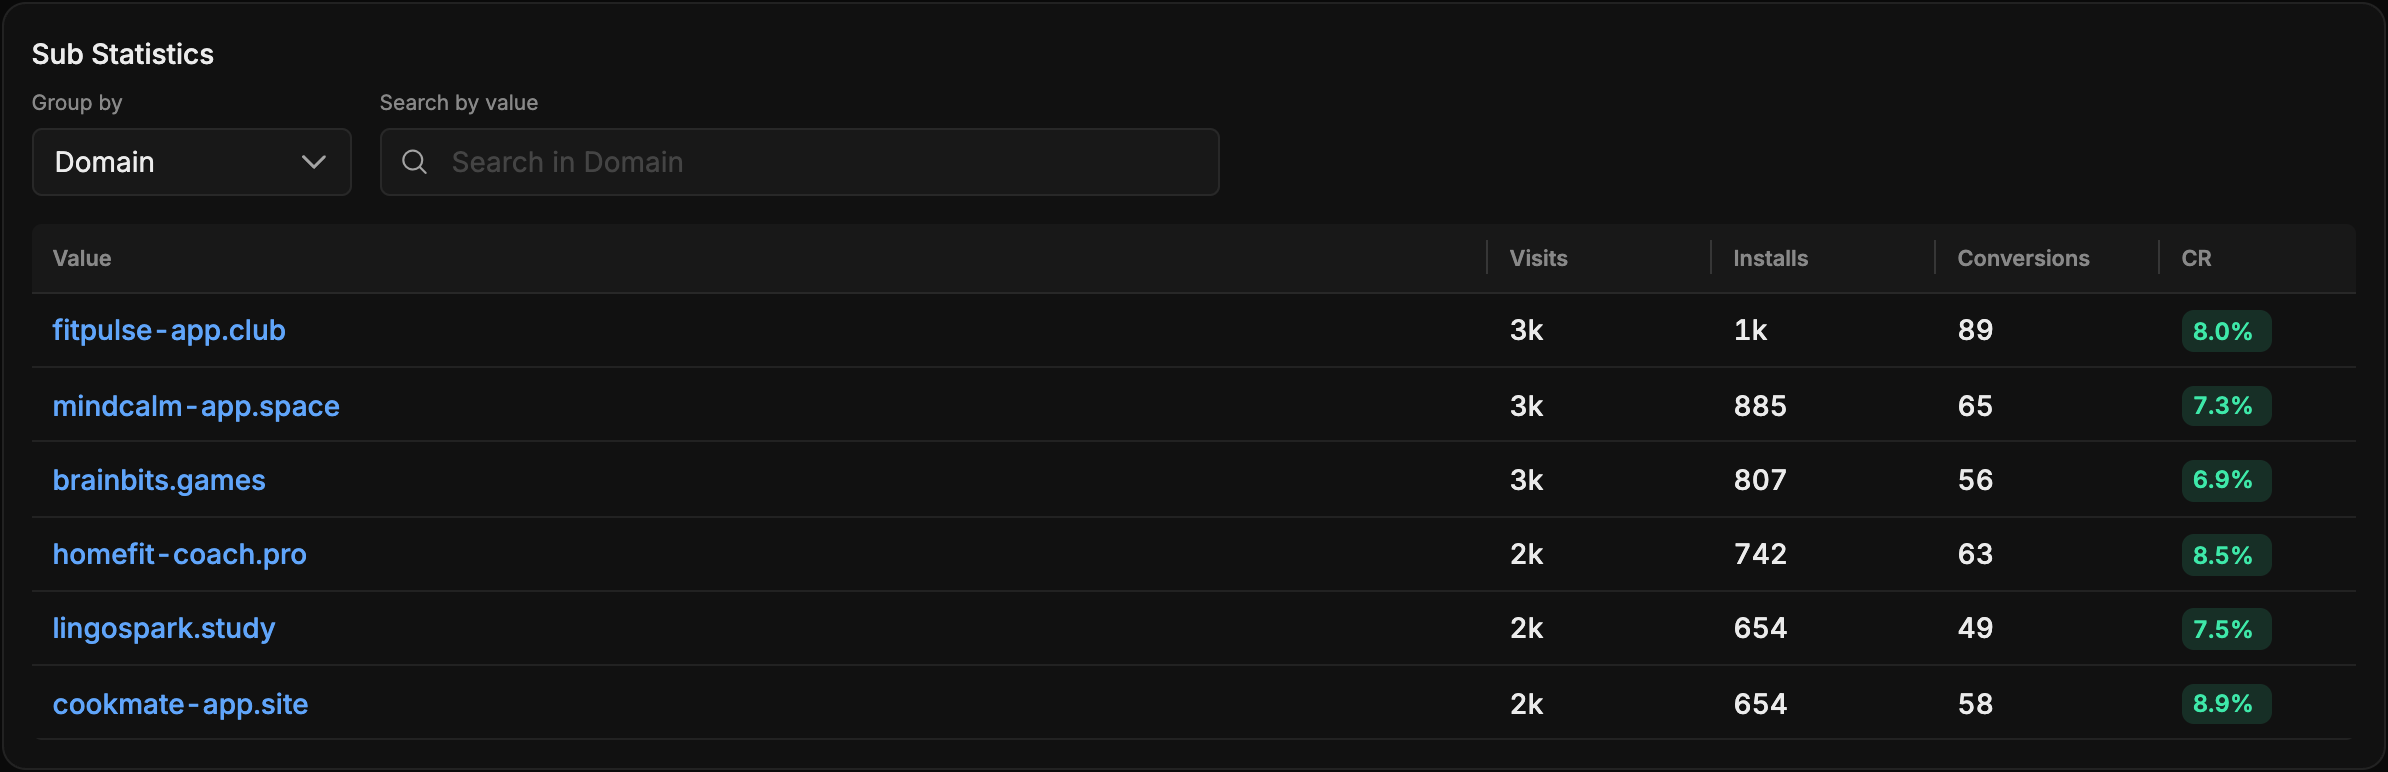
The columns are Value (visits with no tag collect into the Unknown row), Visits, Installs, Conversions and a colour-coded CR. Rows are sorted by installs, so the best performers are always on top.
The top 20 is shown
The table shows the twenty highest rows by installs. If there's more data, a note appears at the bottom - Showing the top 20 rows by installs - so narrow the period or use the search to reach the tail.
Going deeper: drill-down
The table's strongest feature is click-to-filter. Click a value in the Value column and it pins as a filter (the hint says Filter by this value), and the table recalculates for visits with that tag only. Now switch Group by to another slot - and you're looking at the breakdown inside the slice you picked.
A live example: sub_1 is the campaign, sub_2 is the creative.
- Group by
sub_1and find the campaign with a sagging CR. - Click its value - it becomes a filter.
- Switch Group by to
sub_2- in front of you is that campaign broken down by creatives. The weak one stands out immediately.
Active filters hang as chips above the table (the Filtered by: row) - any of them comes off with its cross, and Clear removes them all at once.
Who sees what
The page is available to every user, but the data stays within your teams: you see statistics for the PWAs you have access to and nothing else. Administrators see every app in the instance.
Scripts get the same reports as JSON - see the API section "Statistics".