
Dashboard
The Dashboard is the first screen after signing in and your daily control panel: in a couple of seconds you see how much traffic arrived, how many installs it produced, how many of those reached a deposit, and exactly where people drop off. Every number covers only your PWAs and splits - you never see anyone else's data here.
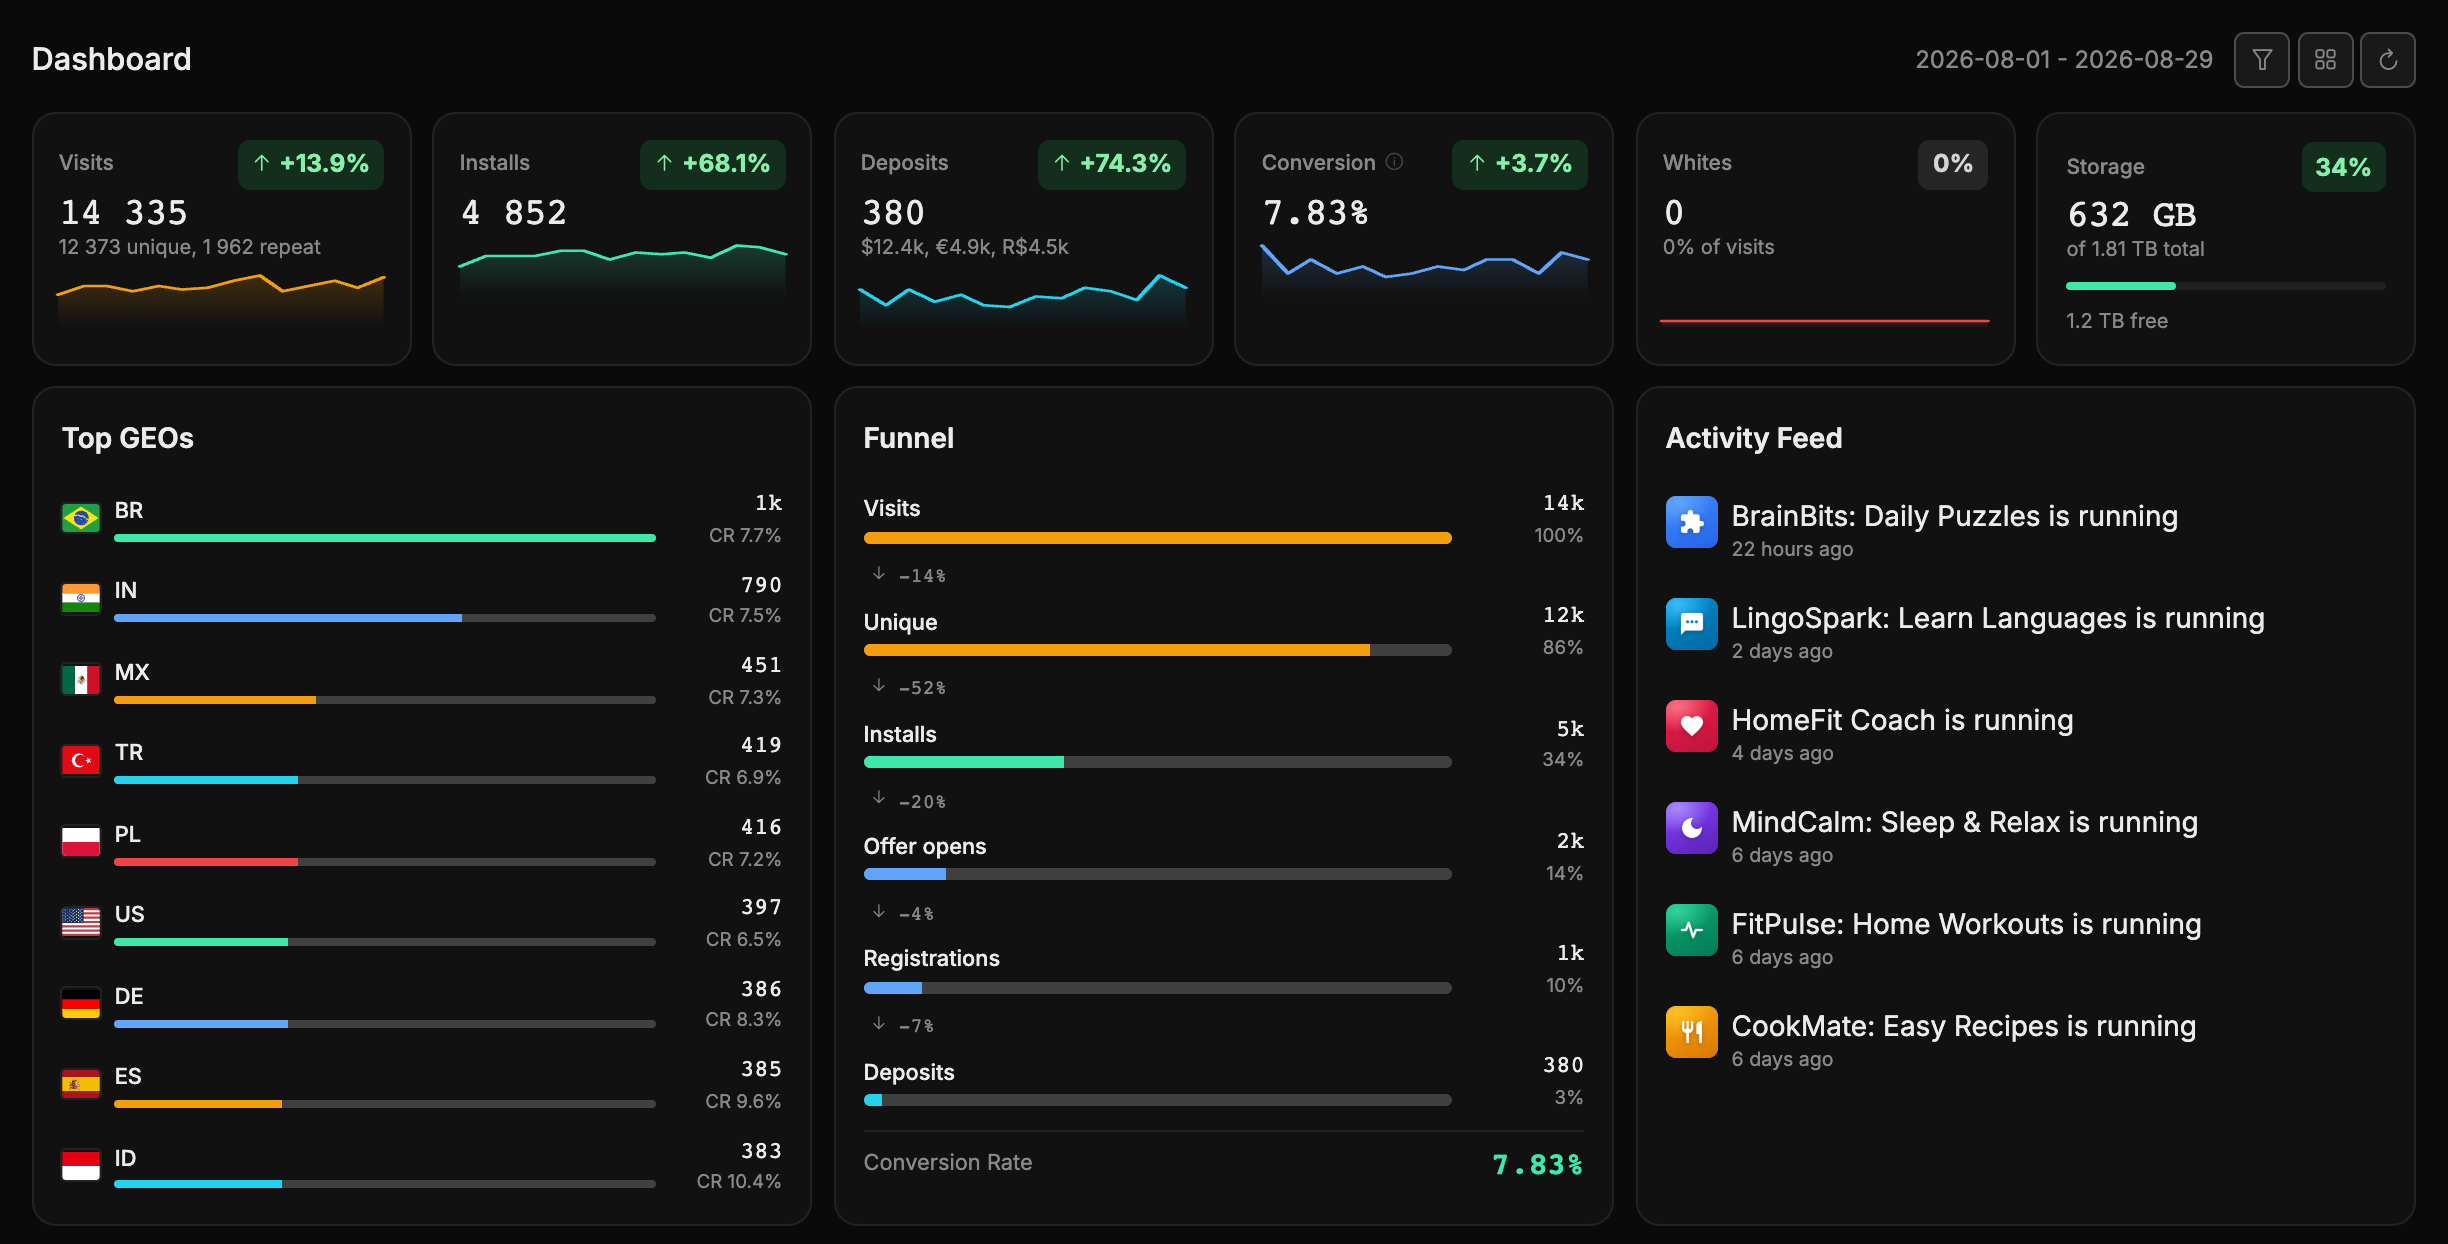
People usually arrive with one of three questions: "what's happening right now?", "how did yesterday's setup perform?" or "which split or country converts best?". Here's how to answer them quickly.
Choosing the period
Everything on the dashboard is counted for the selected period. The current period is labelled in the top right corner and changes in the popover behind the funnel button - it holds the presets Today, Yesterday, Last 7 days, Last 30 days, This month, Last month, and a field for a custom range. A preset applies in one click and the numbers recalculate right away.
Last 30 days is the default. The chosen period is saved to your account: next time the dashboard opens exactly where you left it, from any device.
The arrows button (Refresh) re-reads the numbers for the current period without touching the dates. Most of the time you don't need it - the dashboard updates itself (see below) - but it helps right after you start sending traffic.
A month deep
The dashboard shows at most 31 days: a longer range narrows itself down to the last 31 days. For longer periods use the "Statistics" section - the same funnel is laid out there day by day.
The six cards on top
They answer "how are things going" at a glance. Each one carries a value, a sparkline for the last two weeks and, except for storage, a trend badge.
| Card | What it shows |
|---|---|
| Visits | Total visits, with the unique and repeat split underneath. |
| Installs | How many times the app was installed. |
| Deposits | The number of deposits, with the payouts per currency underneath ($10.2k, R$4.4k, €3.9k). Currencies are never added up into one figure; beyond three, the rest show in the tooltip. |
| Conversion | The average CR for the period. The hint next to it repeats the formula: deposits ÷ installs × 100%. |
| Whites | How many visits went to the white page and what share of all visits that is. Here less is better, so growth is highlighted as negative. |
| Storage | How much disk the server has used: green is fine, amber means keep an eye on it, red means it's running out. |
What the trend compares against
A +12% or −4% badge compares the selected period with the equally long period right before it. Hover the badge and the tooltip shows the exact dates being compared. With the "All time" period (the demo stand) trends are not calculated.
The trend tells you more than the number itself: a green plus on installs with the "Yesterday" preset means the setup is picking up; a minus on conversion while visits grow signals that traffic is flowing but the landing or the offer performs worse - time to look at splits and GEOs.
The funnel
The Funnel widget shows the whole path: Visits → Unique → Installs → Offer opens → Registrations → Deposits, with the resulting Conversion Rate at the bottom.
The percentages to the right of each step are the share of visits - how much of the original traffic survived to that step. Between the steps sits an arrow with a label like −57%: that many percentage points were lost compared with the previous step. A big drop between "Installs" and "Offer opens" means people install the app but never reach the offer; a drop between registration and deposit is a question for the offer, not for your setup.
Registrations and deposits arrive as postbacks
Visits, uniques and installs the panel counts itself, offer opens it records on its own, while registrations and deposits come as postbacks from the affiliate network. Until the postback is configured, those last steps stay at zero - see "Settings", the Offer Postback card.
The other widgets
Top GEOs
Answers "where is the best traffic coming from". For each country you get the flag and code, the number of installs and the country's CR; the length of the bar shows how far the country trails the one at the top of the list, not its share of all installs. CR is colour-coded (green from 5%, amber from 3%, red below), so the GEOs worth attention stand out at once: a country with lots of installs but a red CR is worth narrowing or switching off. Installs with no country fall into the Unknown row.
Activity feed
Recent events for your PWAs and splits, with a timestamp and the app's icon. Rows tied to an app are clickable - one click takes you straight into that PWA.
PWA Applications
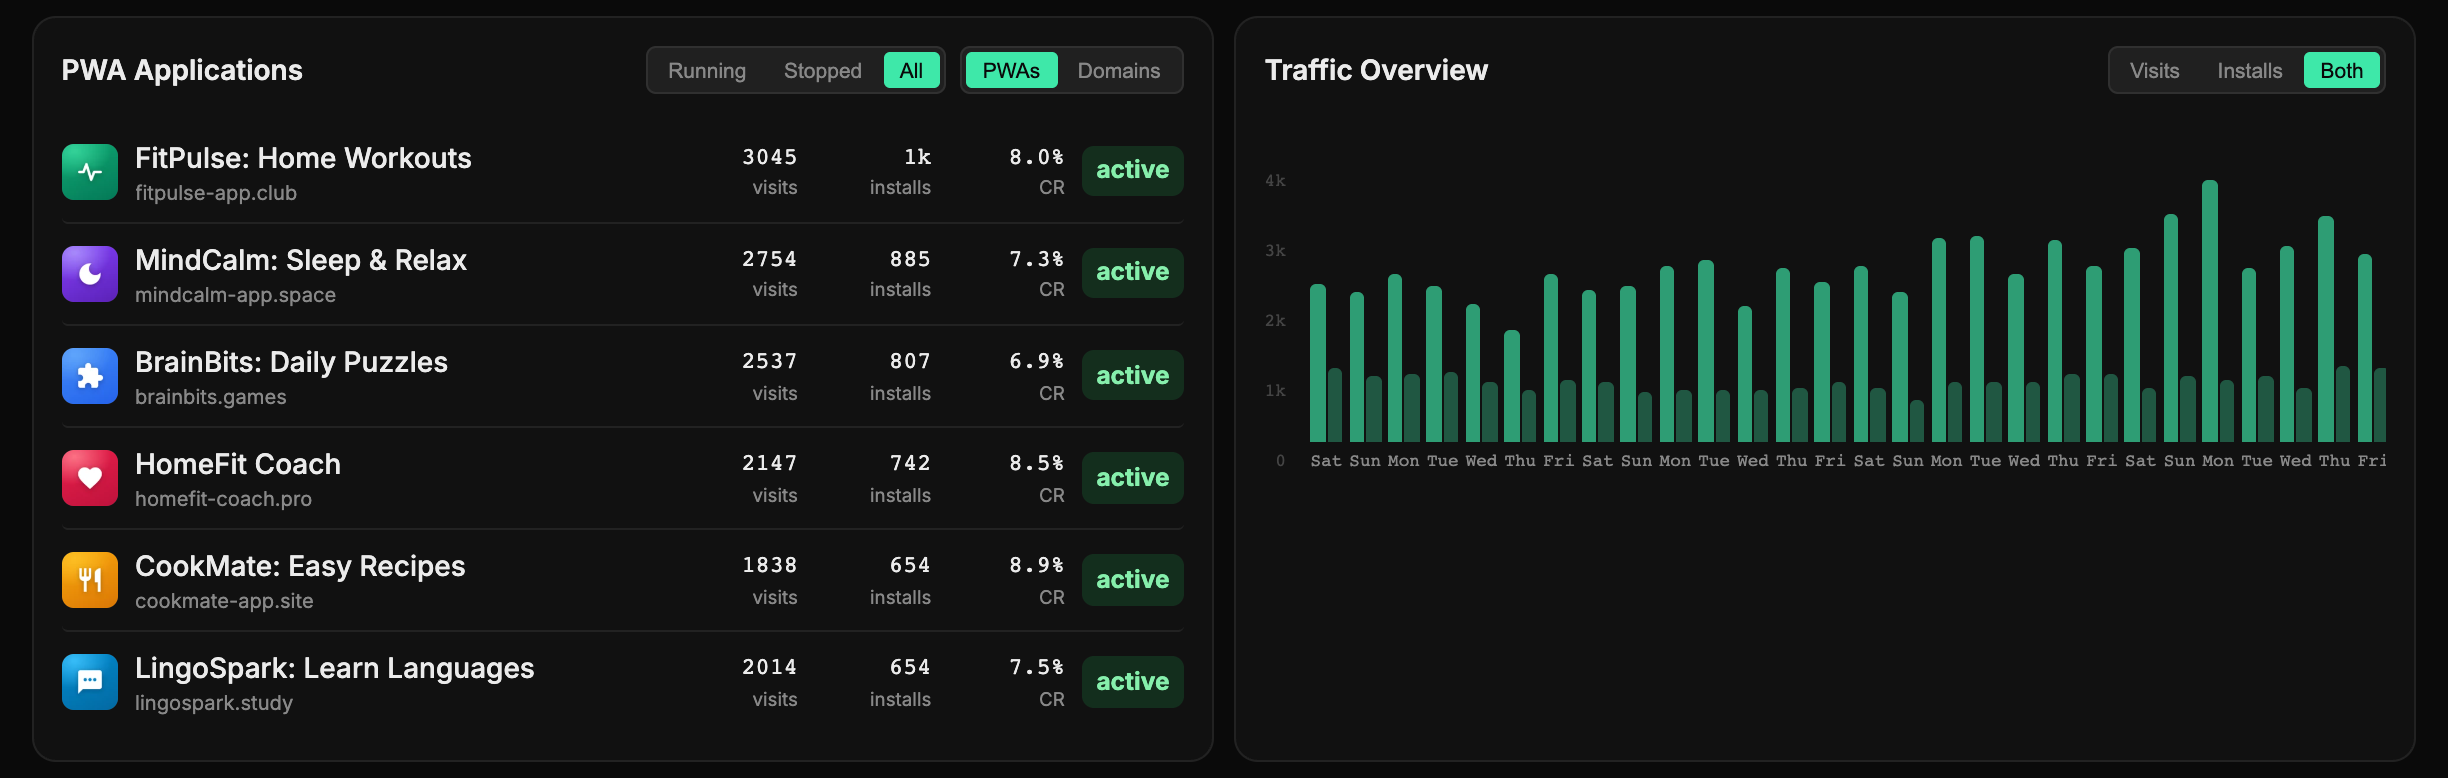
A compact list of all your apps with a status filter - All, Running, Stopped. Each row shows the icon, the domain (with a +N counter if there are several), visits, installs, CR and status, and clicking it opens that PWA. It's essentially a shortcut from the home screen: spotted a sagging CR, went straight in. If nothing matches the filter, you'll see No PWAs matching filter.
The PWAs / Domains switch in the card header shows the top 10 domains by installs instead of apps: visits, installs and CR for each domain visitors came to. This shows which domain pulls traffic and which one is due for replacement.
Traffic Overview
A chart by day for the selected period. The switch on top picks what to show: Visits, Installs or Both (the default). Hover a bar to see the exact values for that day. This is where spikes and dips show up: a sharp peak in visits with no growth in installs is a reason to check whether the setup caught bots or off-target traffic.
Customizing widgets
You can adjust the set, order and width of widgets to suit you. The tiles button (tooltip Customize widgets) next to the period picker turns on edit mode - a green Customize mode bar appears above the widgets:
- drag a card with the mouse to where you want it;
- the - and + buttons on a card make it narrower or wider, and the label between them (1/6, 1/3, 1/2…) shows what share of the screen width the card takes;
- the eye hides a card (a hidden card stays semi-transparent while you're in edit mode, and the same eye brings it back).
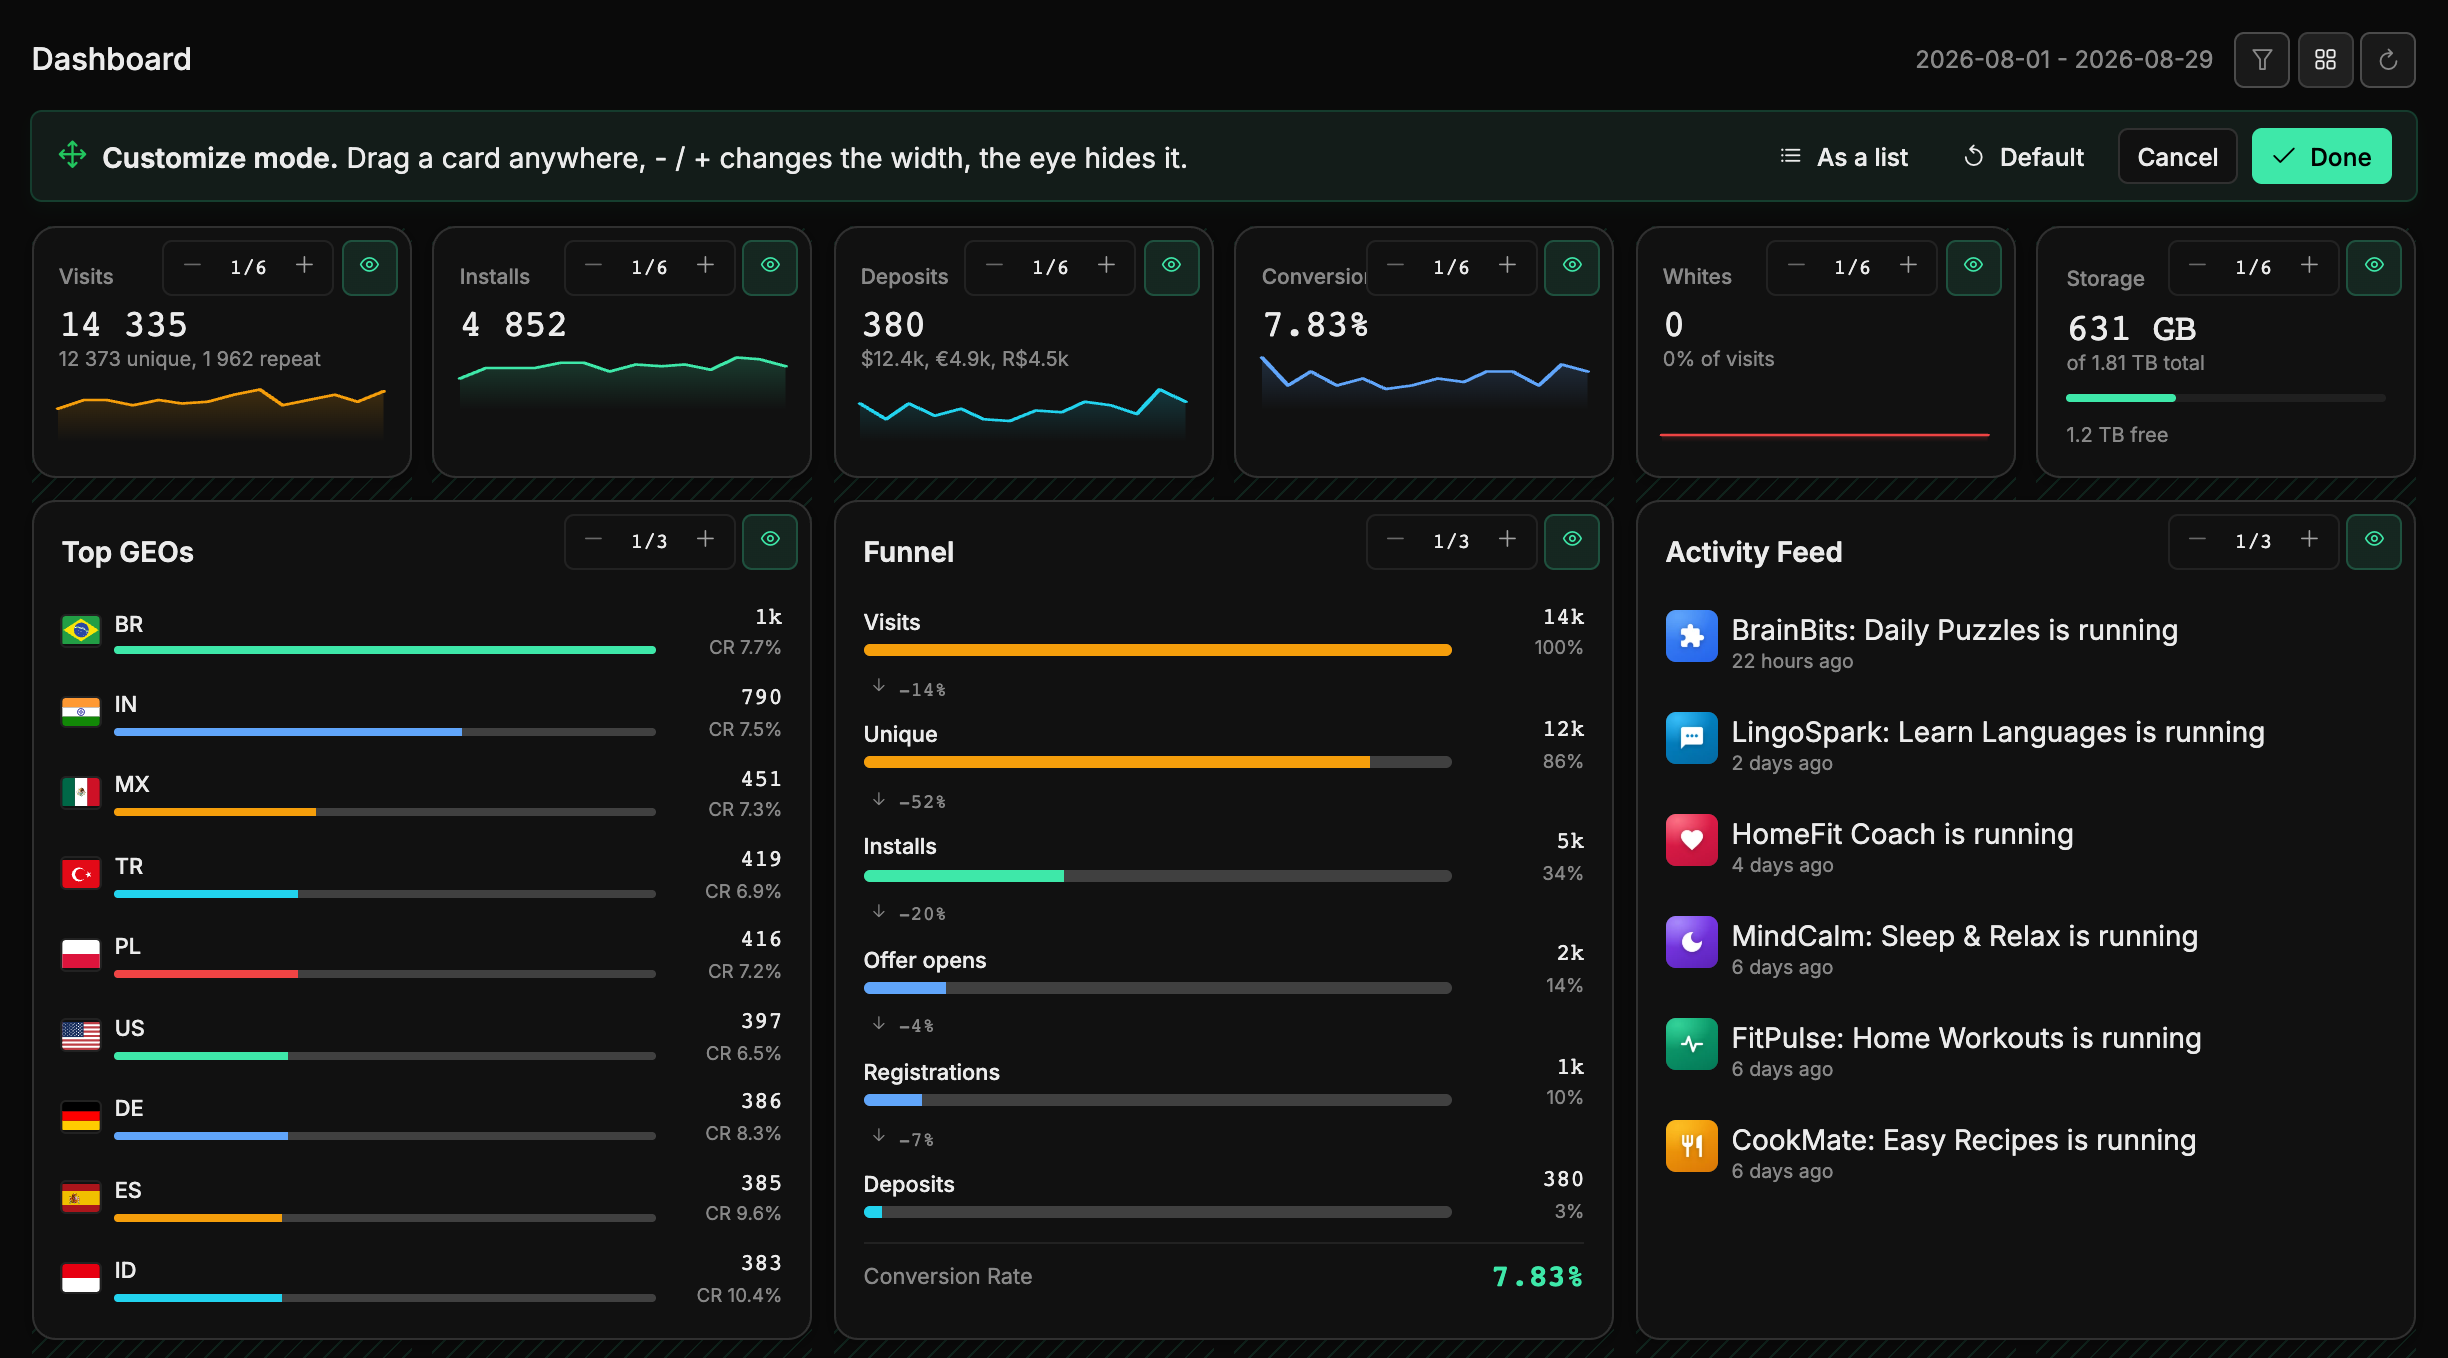
Buttons on the bar:
- As a list - opens a list of all widgets on the right: it's easier to change order, width and visibility there, with a thumbnail of the future layout on top. Apply closes the list.
- Default - restores the default layout.
- Cancel - discards your changes, Done - saves them.
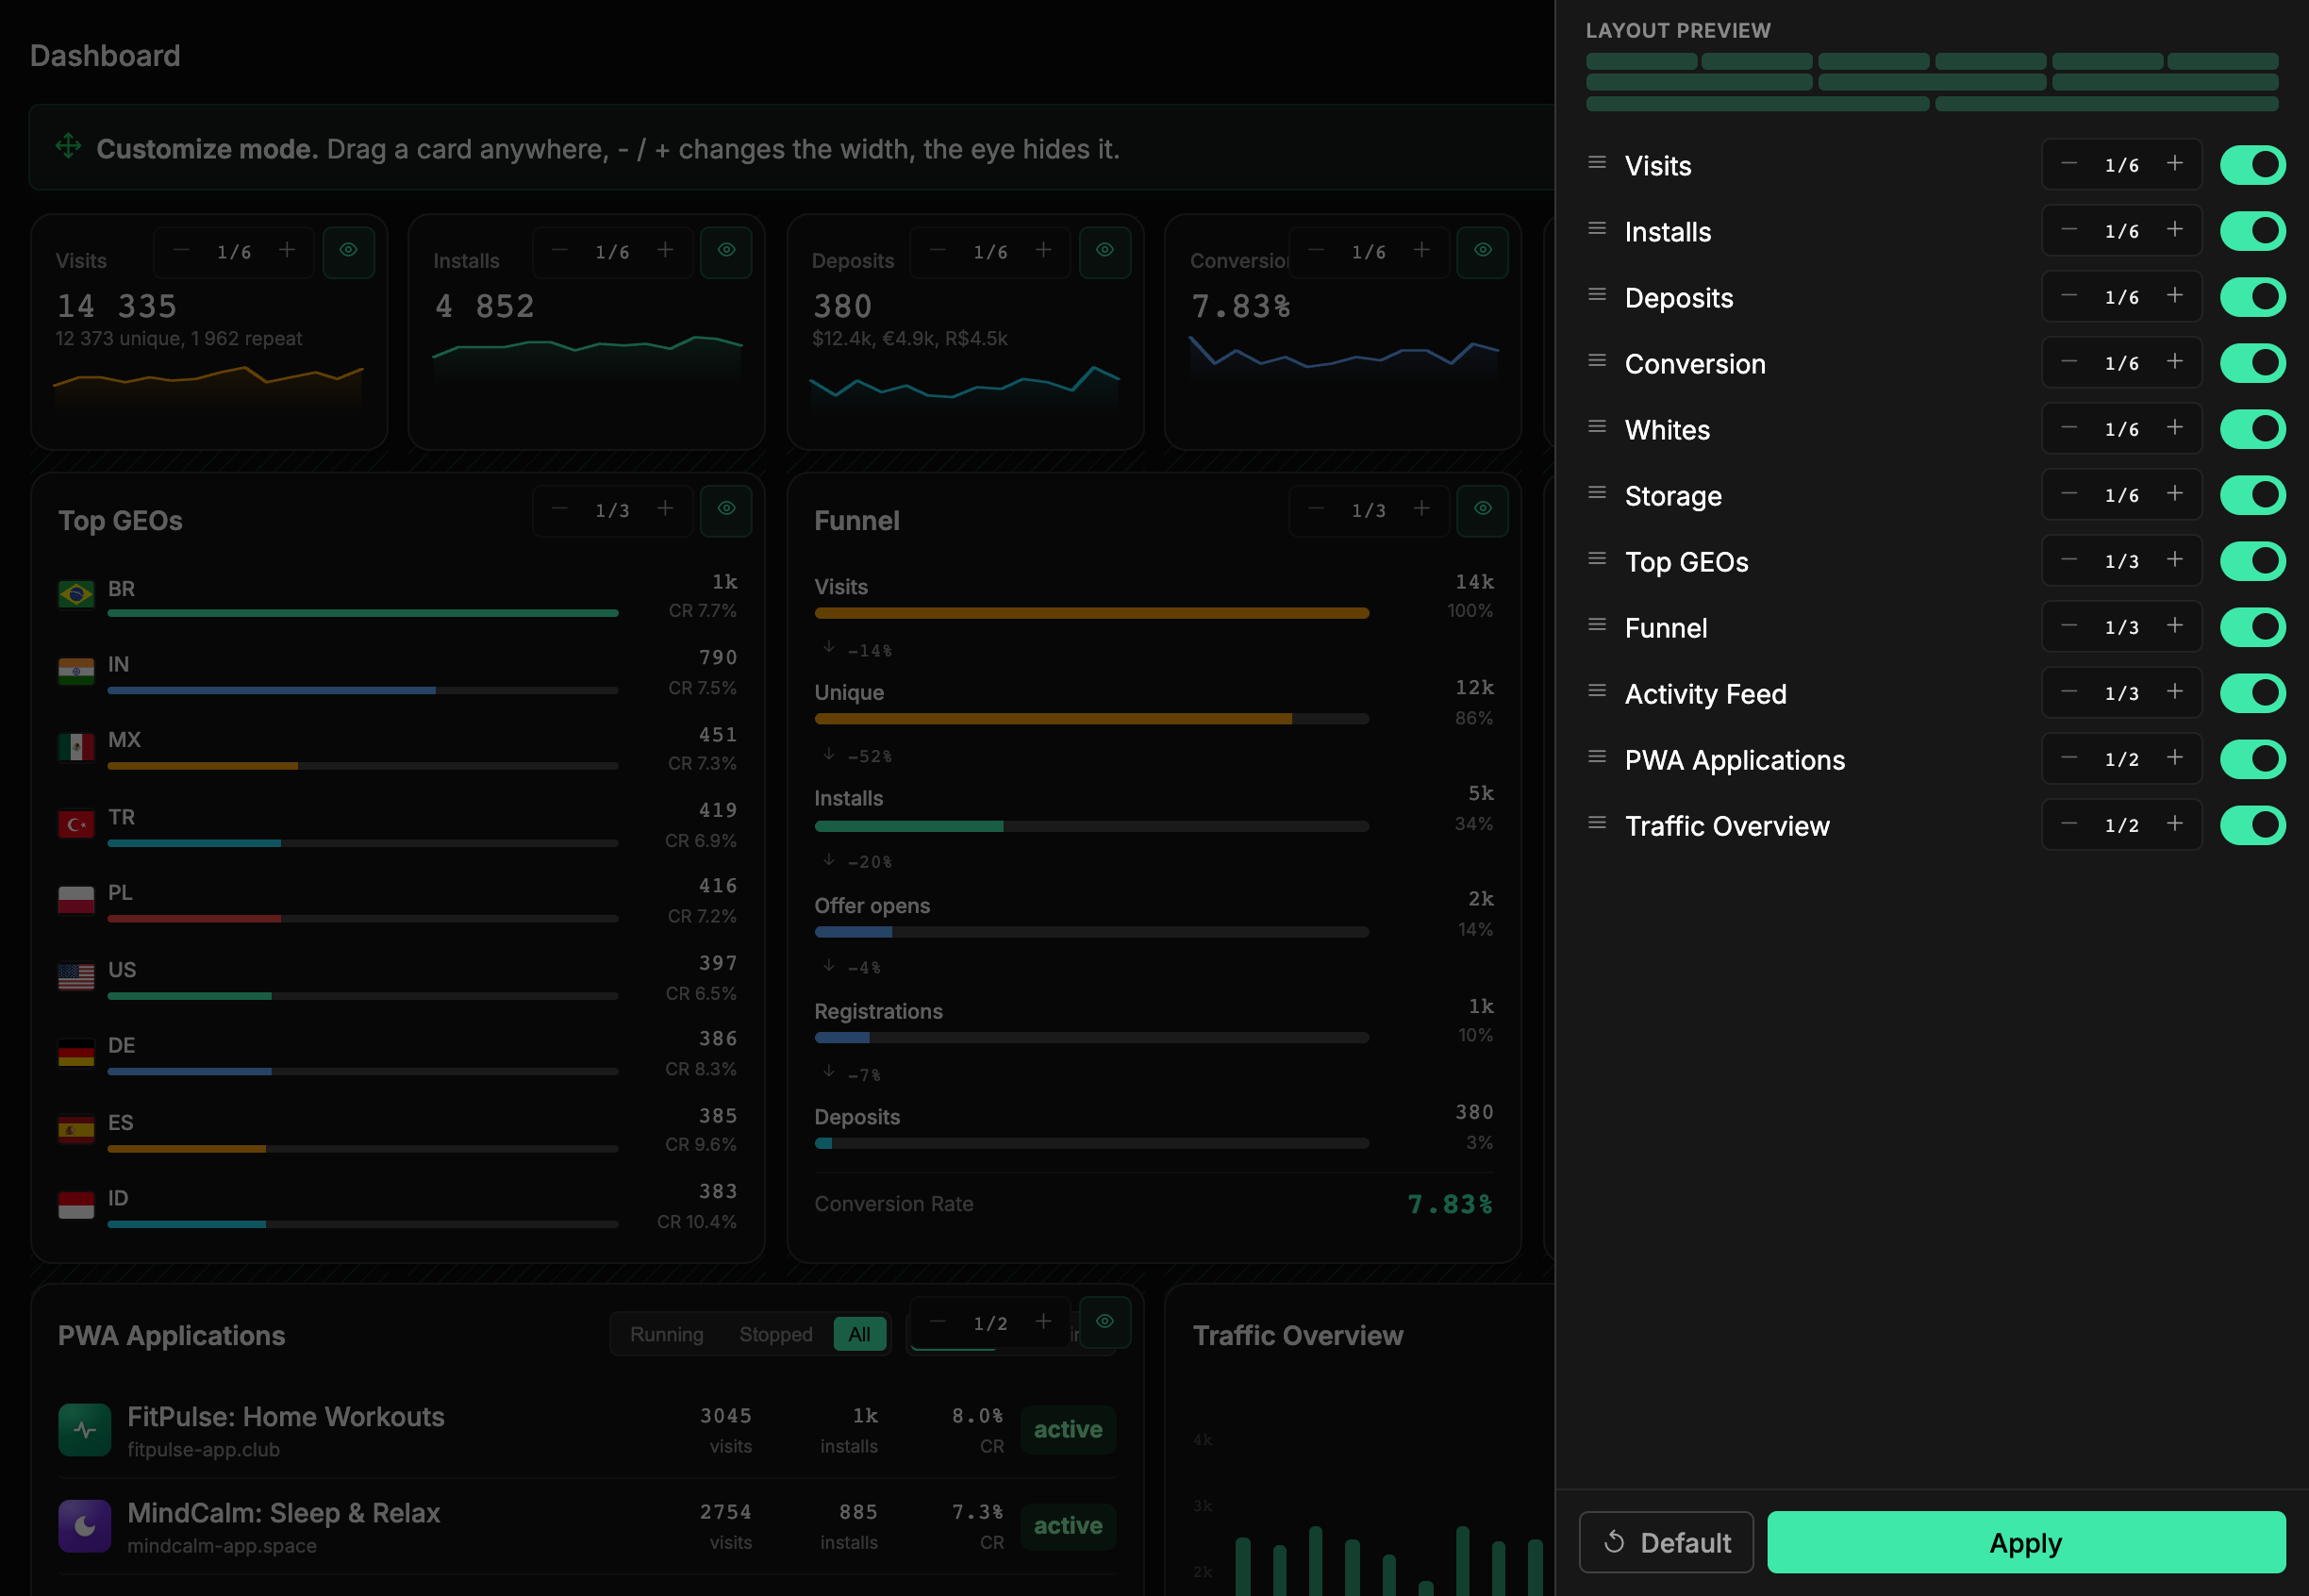
The layout is saved to your account and opens the same on any device. Hidden widgets aren't loaded, so a trimmed-down dashboard opens faster. If you hide everything, the widgets are replaced by the text All widgets are hidden and a button that takes you back to edit mode.
The data updates itself
The dashboard is live: as soon as new visits or installs appear for your PWAs and splits, the numbers and widgets recalculate in the background, with no page reload. If the connection drops for a moment, the data syncs as soon as it's back.
No need to keep hitting "Refresh"
Fresh numbers are pulled in automatically. A manual refresh only helps when you want to force a check right now - straight after starting a campaign, for instance.
Scripts get the same numbers as JSON - see the API section "Statistics".